Title here
Summary here
You work in Tracking - Analytics - Data Viz - Data Eng - Media Buying?
JOIN US ON DISCORDUpdated: Sunday, September 1, 2024
The current server-side tracking system is not working properly and is not optimized. As online acquisition is a real challenge for this customer, it is impossible to continue under these conditions, as the data is not flowing properly either in Matomo or in the various advertising networks. The aim of this mission is therefore to correct the server-side tracking that has been put in place.
This client prefers to remain anonymous for reasons of confidentiality.
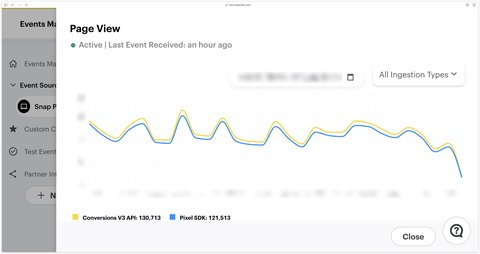
Meta Ads
Pinterest Ads
Tiktok Ads
Snapchat Ads
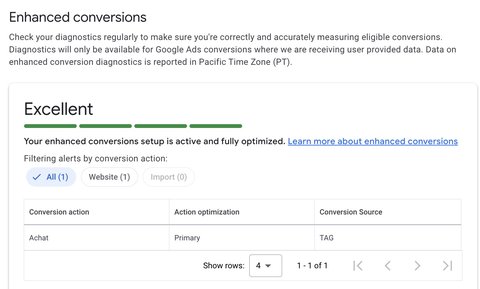
Google Ads
Matomo Analytics

On a Shopify (or Shopify+) store, the checkout and thank-you pages are in a sandbox. This is a specific environment that doesn’t allow cookies to be sent correctly. If nothing is done to remedy this, there will be many problems with data quality in all our tools.

Addingwell’s Cookie Restore feature restores cookies even in the sandbox.
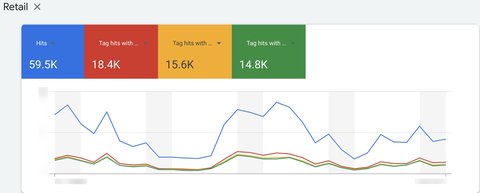
Differences between browser and server requests over the last 28 days.
+9% on purchase events.
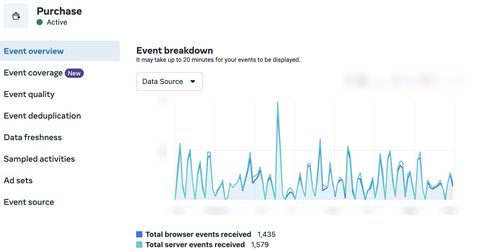
+4.7% on payment initiation events (begin_checkout)
+9.8% on page view events (page_view)

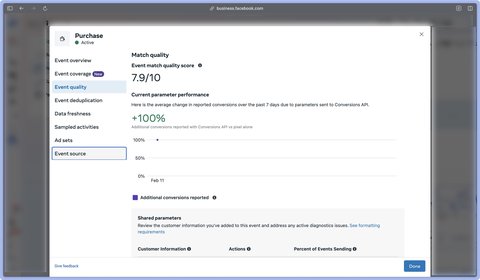
=> 7.9/10
This quality score largely represents the user data (email, phone number, etc.) sent to Meta. A good score is between 7 and 10 for the purchase event.
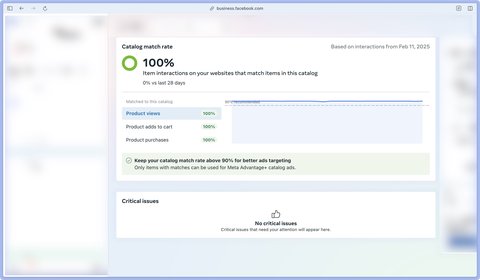
=> 100%
Matching products with the Meta catalog ensures optimal distribution of Meta Advantage+ ads.
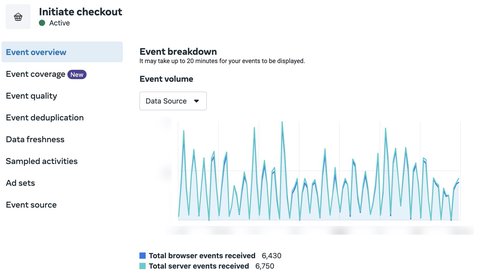
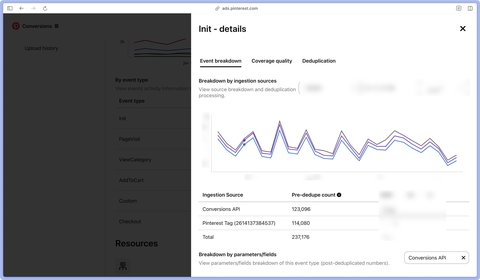
Differences between browser and server requests over the last 28 days.
+4.9% on purchase events.
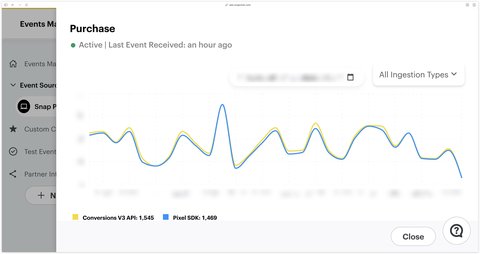
+5.8% on payment initiation events (begin_checkout)
+7% on Page View events (page_view)

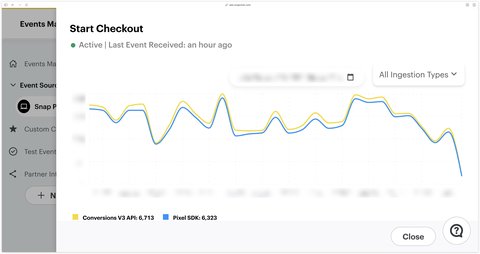
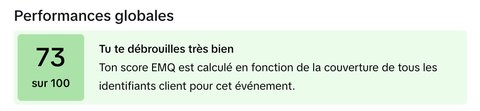
Differences between browser and server requests over the last 28 days.
=> 73
Difference between browser vs. server requests over the last 28 days.
+9.5% on purchase events
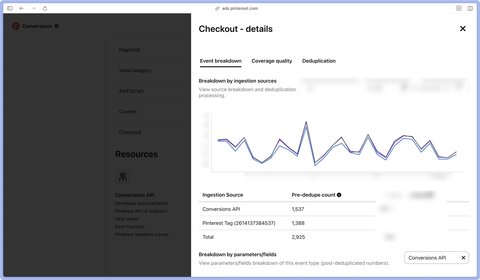
+7.3% on page view events (page_view)
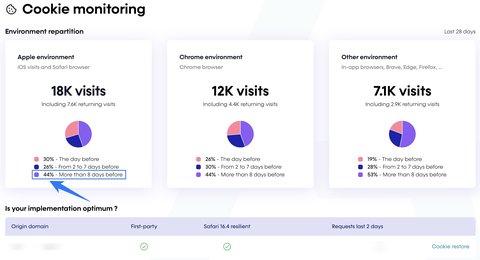
44% of returning visitors returned after 8 days on Safari (ITP bypass is active)
Explanation of Safari ITP impacts
On a client-side setup, first-party cookies dropped in Safari are limited to 1 day.
On a classic Server-Side setup, first-party cookies are limited to 7 days.

This case study shows you the positive impacts of server-side tracking both in terms of the volume of events obtained in addition to data quality with user data (enhanced conversions, event quality score) and the extension of cookie lifespan (safari ITP bypass).
In this case study, I’m not talking about the overall impact on sales or cost of acquisition, as I feel that tracking (whether client-side or server-side) is only one piece of the puzzle. What’s more, it’s difficult to establish a precise causality between tracking and business performance. As I often say to my customers:
Server-side tracking is the solution that will provide you with the optimum technical conditions to drive advertising performance.

myBlend achieved +200% revenue growth in a single year.